Skeda:Archimedean spiral polar.svg
Kërceni tek navigimi
Kërceni tek kërkimi

Size of this PNG preview of this SVG file: 591 × 600 pixel. Rezolucione të tjera: 236 × 240 pixel | 473 × 480 pixel | 757 × 768 pixel | 1.009 × 1.024 pixel | 2.018 × 2.048 pixel | 609 × 618 pixel.
Skedari origjinal (skedë SVG, fillimisht 609 × 618 pixel, madhësia e skedës: 91 KB)
Përmbledhje
| Përshkrimi |
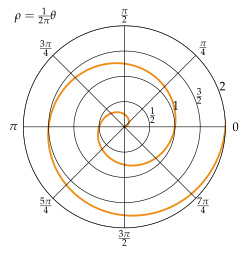
Français : Spirale d'Archimède représentée sur un graphe polaire English: Archimedean spiral represented on a polar graph |
| Data | |
| Burimi | Punë e juaja |
| Autori | Guillaume Jacquenot |
Source code (Python)
# -*- coding: utf-8 -*-
#
# Script to plot an Archimedean spiral
#
# http://en.wikipedia.org/wiki/Archimedean_spiral
#
# The Archimedean spiral (also known as the arithmetic spiral
# or spiral of Archimedes) is a spiral named after the 3rd
# century BC Greek mathematician Archimedes. It is the locus
# of points corresponding to the locations over time of a
# point moving away from a fixed point with a constant speed
# along a line which rotates with constant angular velocity.
#
# Text under the
# Creative Commons Attribution-ShareAlike License
# **************************************************************
#
#
# Guillaume Jacquenot
# 2013/03/17

import numpy as np
from fractions import Fraction
import matplotlib
from matplotlib.pyplot import figure, show, rc, grid

def updateThetaAxis(ax):
    thetaFractions = [Fraction.from_float(item/np.pi) for item in ax.get_xticks()]
    labels=[]
    for f in thetaFractions:
        if f.numerator==0:
            labels.append('0')
        elif f.numerator==f.denominator:
            labels.append('\\pi')
        elif f.numerator==1:
            labels.append('\\frac{{\\pi }}{'+str(f.denominator)+'}')
        else:
            labels.append('\\frac{{'+str(f.numerator)+'\\pi }}{'+str(f.denominator)+'}')
    labels = ['$\\Large'+l+'$' for l in labels]
    ax.set_xticklabels(labels,fontsize=20)

def updateRAxis(ax):
    thetaFractions = [Fraction.from_float(item) for item in ax.get_yticks()]
    labels=[]
    for f in thetaFractions:
        if f.numerator==0:
            labels.append('0')
        elif f.numerator==f.denominator:
            labels.append('1')
        elif f.denominator==1:
            labels.append(str(f.numerator))
        else:
            labels.append('\\frac{{'+str(f.numerator)+'}}{'+str(f.denominator)+'}')
    labels = ['$'+l+'$' for l in labels]
    ax.set_yticklabels(labels,fontsize=20)

def makePlot(outputFilename = r'Archimedean_spiral_polar.svg'):
    rc('grid', linewidth=1, linestyle='-') # color='#316931'
    rc('xtick', labelsize=15)
    rc('ytick', labelsize=15)
    rc('font',**{'family':'serif','serif':['Palatino'],'size':14})
    rc('text', usetex=True)

    width, height = matplotlib.rcParams['figure.figsize']
    size = min(width, height)
    fig = figure(figsize=(size, size))
    ax = fig.add_axes([0.12, 0.12, 0.76, 0.76], polar=True, )#axisbg='#d5de9c'

    r = np.arange(0, 3.0, 0.01)
    theta = 2*np.pi*r
    ax.plot(theta, r, color='#ee8d18', lw=3)
    ax.set_rmax(2.0)
    updateThetaAxis(ax)
    updateRAxis(ax)
    grid(True)
    ax.set_title('$\\rho=\\frac{1}{2\\pi}\\theta$',fontsize=20)
    fig.savefig(outputFilename)
    fig.show()

makePlot()
Licencim
Unë, krijuesi i kësaj pune, e publikoj këtu në bazë të licensës në vijim:
Kjo skedë licencohet sipas Creative Commons Attribution-Share Alike 3.0 Unported.
- Je i lirë të:
- ta shpërndani – ta kopjoni, rishpërndani dhe përcillni punën
- t’i bëni “remix” – të përshtatni punën
- Sipas kushteve të mëposhtme:
- atribuim – Duhet t’i jepni meritat e duhura, të siguroni një lidhje për tek licenca dhe të tregoni nëse janë bërë ndryshime. Këtë mund ta bëni në ndonjë mënyrë të arsyeshme, por jo në ndonjë mënyrë që sugjeron se licencuesi ju del zot juve apo përdorimit tuaj.
- share alike – Nëse bëni një “remix”, e shndërroni, ose ndërtoni duke u bazuar te materiali, duhet t’i shpërndani kontributet tuaja sipas të njëjtës licencë ose një të tille të përputhshme me origjinalen.
Historiku i skedarit
Kliko mbi një datë/orë për ta parë skedarin siç është shfaqur në atë kohë.
| Data/Ora | Miniatura | Përmasat | Përdoruesi | Koment | |
|---|---|---|---|---|---|
| e tanishme | 18 mars 2013 19:17 | | 609 × 618 (91 KB) | wikimediacommons>AnonMoos | move formula to side, adjust margins |
Përdorimi i skedarit
faqe lidhet tek kjo skedë: